
The tan and blue paper nautical charts that line wheelhouses and galleys on Alaska ships will soon be a relic of the past.
In an effort to increase automation and adapt to digital navigation, the National Oceanic and Atmospheric Administration is rebuilding its chart products for digital use, said Rear Admiral Shep Smith, Director of the Office of Coast Survey.
The effort will take about 10 years and allow for more seamless navigation, and a larger level of detail, Smith said.
“The paper charts that we all grew up and know and love were the traditional way of capturing the survey information and making it actionable for mariners,” Smith explained.
Not so anymore. The move isn’t just a matter of digitizing its paper charts. NOAA and its partners already do that. Many global positioning systems used on vessels simply layer a ship’s GPS positioning on top of NOAA’s charts.
The Office of Coast Survey will have to totally revamp how it builds charts to properly adapt them for digital and automated uses.
“We’re basically starting over and redesigning a suite of nautical charts that is optimized and designed from the ground up to be used digitally. It’s not intended to be used on paper,” Smith said.
Right now, NOAA produces new editions to nautical charts periodically. There are over 1,000 of these charts, each detailing a certain area at a certain scale.
Each chart has an edition date and uses certain contour lines for water depth — similar to the contour lines used on land maps to show the height of a mountain at a certain position, for instance.
But those lines — and other features of the paper charts — are inconsistent, a function of the charts being designed as paper products.
The first contour line on one nautical map may indicate a water depth of 10 fathoms (60 feet). On another chart, the first contour line might indicate a depth of 30 fathoms (180 feet).
There are discrepancies in scale, too. NOAA uses over 100 different scales in paper charts of U.S. waters. At each different scale, there’s a difference in the level of detail.
When moving from open water, traveling across the Gulf of Alaska, for instance, a mariner might use a larger scale chart — they don’t need the level of detail when traveling open waters. When a ship approaches an anchorage, where knowing the exact location of a rock in a small area becomes important, they might switch to a chart with a smaller scale.
With something like Google Earth, the transition between the two scales is seamless. Just zoom in and greater levels of detail reveal themselves.
That’s one of the hopes of the new system, Smith said.
“If you use the nautical charts that we have now, derived from the paper in the digital format, there are discontinuities … they don’t line up,” Smith said. “There’s all these artifacts of the fact that they’re derived from paper.”
The redesign is intended to make automated and unmanned vessel navigation easier. Smith used the example of cruise ships. (Five cruise ships were in Juneau on Wednesday when Smith spoke to the Empire about the project at a meeting of the Hydrographic Services Review Panel.)
Cruise ship captains have to know their vessel’s exact location in relation to the shore to be sure they’re discharging waste in a legal area. But discharge regulations aren’t delineated on a map. Instead, they’re written down and enforced by the Alaska Department of Environmental Conservation.
Right now, cruise ships take DEC’s written regulations and translate them into action plans for their engineers to be able to avoid dumping waste too close to shore. With NOAA’s digital built charts, the system could be more foolproof.
“In an automated world, the ship itself and the ship’s systems could know whether it was in a discharge zone or what kind of discharge regime it’s in,” Smith said.
As is happening on terrestrial highways, driverless technology may soon take to ocean shipping lanes. Smith said Alaska could see an increase in unmanned — or less-manned — shipping in coming years.
Those vessels will need purpose-built charts to move about safely, Smith said. The Office of Coast Survey is working with a crew from the University of New Hampshire to make unmanned survey vessels aware of where they’re at in the ocean.
“Within the lifespan of the charts that we’re beginning to make now, there will be unmanned ships … The algorithms that would control an unmanned ship would have to interact with the chart,” Smith said.
• Contact reporter Kevin Gullufsen at kgullufsen@juneauempire.com. Follow him on Twitter at @KevinGullufsen.
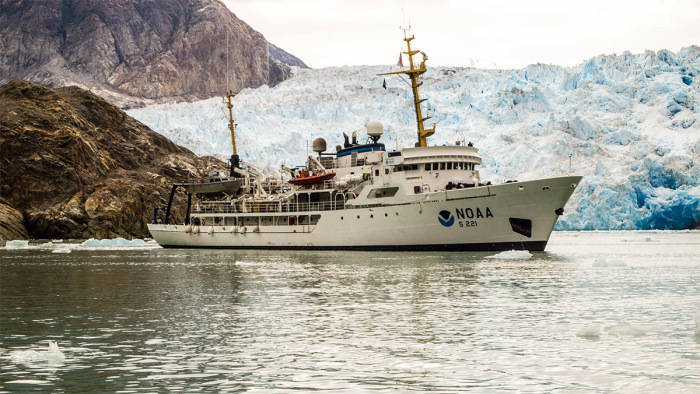
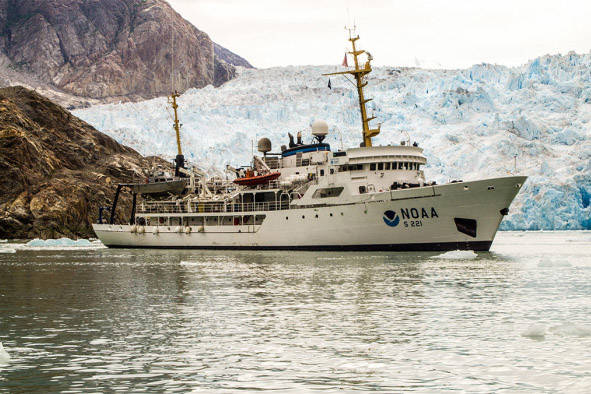
National Oceanic and Atmospheric Administration vessel Rainier is pictured during a survey of Tracy Arm Fjord and Lisianski Inlet in Southeast Alaska this June. NOAA is rebuilding its charts for digital use. (Courtesy Photo | Ensign Collin Walker via NOAA) National Oceanic and Atmospheric Administration vessel Rainier is pictured during a survey of Tracy Arm Fjord and Lisianski Inlet in Southeast Alaska this June. NOAA is rebuilding its charts for digital use. (Courtesy Photo | Ensign Collin Walker via NOAA)
