Sketching student STEM representation
Published 9:31 pm Wednesday, April 25, 2018
“Draw a scientist.”
The majority of the first-graders drew a white man with a lab coat, unruly hair, and safety goggles. I became their scientist in the classroom a few days later.
When we repeated the Draw-a-Scientist Test after a year of hands-on, inquiry-based science, the drawings reflected the diversity of the students themselves.
The Draw-a-Scientist Test measures not only students’ “perceptions of who is a scientist” but also “their perceptions of who can be a scientist” (Steinke, in Yong, 2018), which influence their future engagement with classes and careers. Nationwide discussion of the need for increased diversity in science, technology, engineering and mathematics (STEM) fields has intensified over recent years.
Local STEM stats
Where does Juneau stand currently? Is student representation in STEM classes proportional to school demographics?
The following table shows demographic enrollment in elective STEM classes at Juneau-Douglas High School for Fall 2017, requested by the JDHS Site Council as part of its efforts to improve equity in STEM participation. Alaska Native, Asian, Black, Hispanic, Pacific Islander and Multi-Ethnic students — 47 percent of the school population — were underrepresented in all STEM classes except Anatomy &Physiology (52 percent); Oceanography (47 percent); and Honors Algebra 2/Trigonometry (48 percent). Alaska Native students were underrepresented (15 percent) in every STEM class except Oceanography (18 percent); nine of the 16 classes had 0 percent Alaska Native students. Race and ethnic representation varied among disciplines and among levels. For example, Alaska Native students were 15 percent of Algebra 2/Trigonometry, but 9 percent of Honors Algebra 2/Trigonometry.
Gender representation varied among STEM disciplines. Female students were underrepresented (48 percent) in Calculus, Calculus BC, Chemistry, Principles of Engineering, Physics, AP Physics, and AP Statistics. Principles of Engineering was 95 percent male, while Anatomy &Physiology was 74 percent female. All physics classes were 73 percent male, while Oceanography was 82 percent female. Gender representation also differed among course levels within the same discipline: for example, all calculus classes were 65 percent male, while Calculus BC was 100 percent male.
Demographic STEM enrollment for Fall 2017 at the University of Alaska Southeast (UAS) differed from that of JDHS, according to data provided by UAS Institutional Effectiveness. Female students made up 66 percent of UAS’s student body in Fall 2017. While female students were the majority (>50 percent) in 11 of 16 STEM classes, they were underrepresented (66 percent) in 10, most dramatically in Automotive Technology (29 percent), Aviation Technology (40 percent), Construction Technology (27 percent), and Diesel Technology (8 percent). Alaska Native or American Indian students were underrepresented (19 percent) in eight of 16 STEM classes in Fall 2017, most dramatically in Automotive Technology (0 percent) and Physics (4 percent).
The JDHS and UAS data constitute a snapshot of gender, race and ethnic STEM representation during one semester. However, their patterns accord with national trends, where there is underrepresentation of all race and ethnic groups other than white, and gender representation varies among STEM disciplines, particularly at the professional level. For example, though women and men enter careers in biology at about the same rate, women continue to be underrepresented in the physical and geosciences, engineering and technology.
BRIGHT
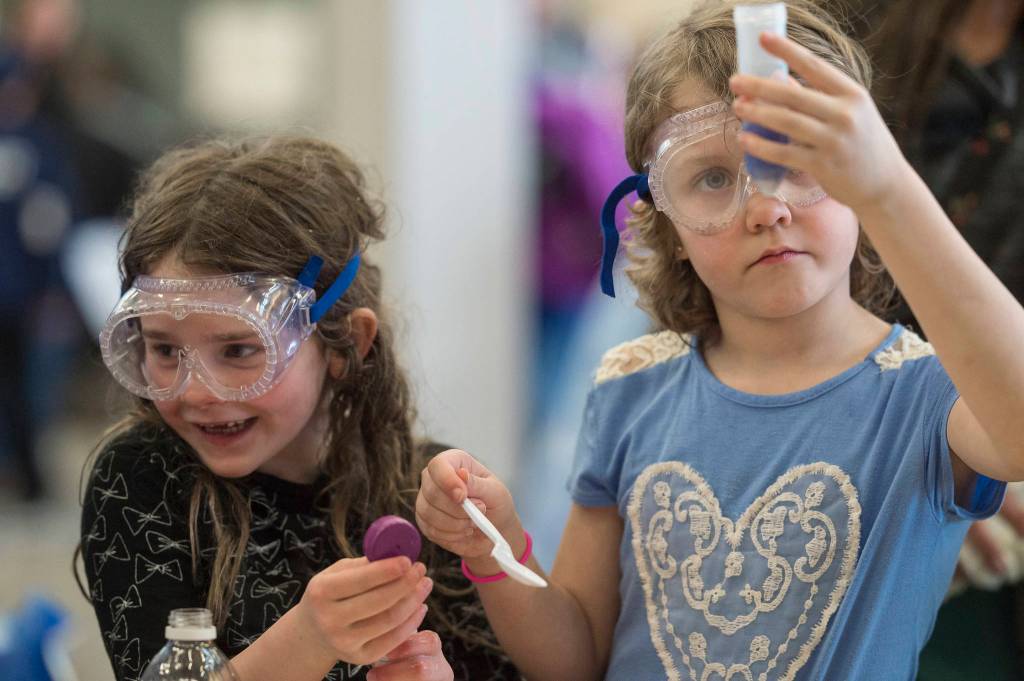
One entity (among many) working locally to reduce this imbalance is BRIGHT (Broadening Research Interest in Geosciences, Habitat, and Technology) Girls, a University of Alaska Fairbanks project funded by the National Science Foundation. Our biology-geology summer academies for local high school girls foster science identities through research and mentoring. Students see themselves as scientists, particularly when using scientific equipment to gather data for their research projects.
Hands-on STEM experiences in and out of school benefit not only female students, but people of all ages. In addition to gender, race and ethnicity, STEM representation also is concerned with factors such as disability, immigration status, language, sexual orientation and socioeconomic background. My first-graders sang, “Everybody’s a scientist/Everywhere there are questions” (the opening lines of Jim Thompson’s song “Scientific Process”). How can our community work toward more equitable representation of students in STEM classes, and, by extension, careers? What factors affect students’ decisions about which classes to take? When will student drawings and STEM enrollment data depict more diverse backgrounds, identities and experiences?
• Gabrielle Vance is an Educational Designer and Instructor for the BRIGHT Girls project at the University of Alaska Fairbanks Geophysical Institute. STEM Corner is a monthly column about Science, Technology, Engineering and Math in Juneau, written by a rotating group of Juneau STEM Coalition members.